In [1]:
import matplotlib.pyplot as plt
In [2]:
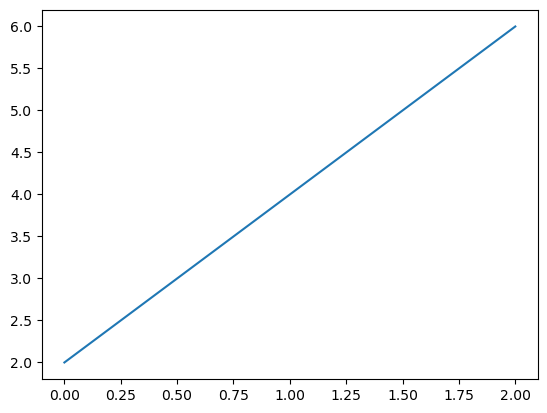
y = [2, 4, 6]

# plot - 선 그래프(Line plot)
plt.plot(y)
plt.show()
In [3]:
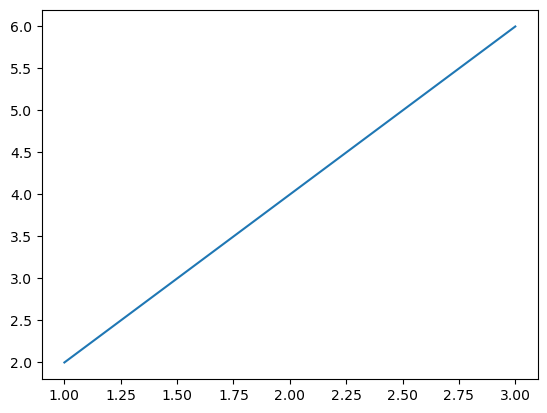
y = [2, 4, 6]
x = [1, 2, 3]

# plot - 선 그래프(Line plot)
plt.plot(x, y)
# x 와 y의 갯수가 맞지 않으면 error
plt.show()
In [4]:
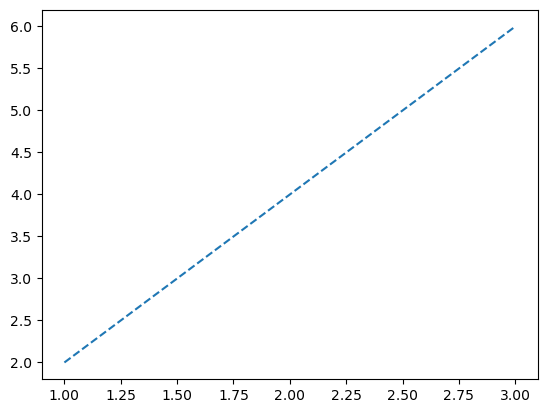
# line style -> ls
plt.plot(x,y, ls = '--')
plt.show()
In [5]:
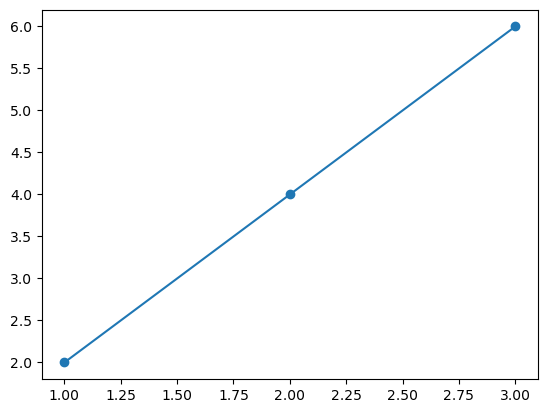
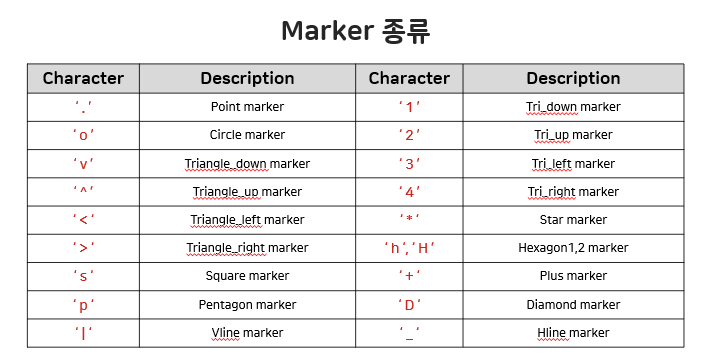
# Marker
plt.plot(x, y, marker='o')
plt.show()
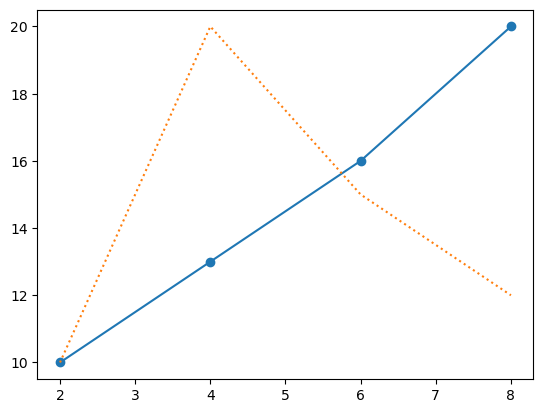
In [6]:
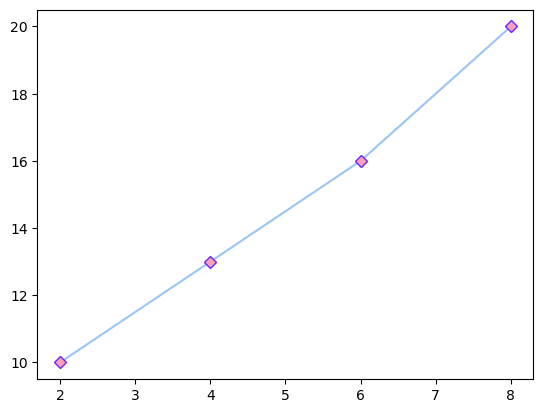
x = [2, 4, 6, 8]
y = [10, 13, 16, 20]
y2 = [10, 20, 15, 12]

plt.plot(x, y, ls = '-', marker='o')  # 그래프 그리기
plt.plot(x, y2, ls = ':')
plt.show()                # 그래프 보여주기
In [7]:
# line width 선 두께 -> lw
plt.plot(x, y, lw = 5)
plt.show()
In [8]:
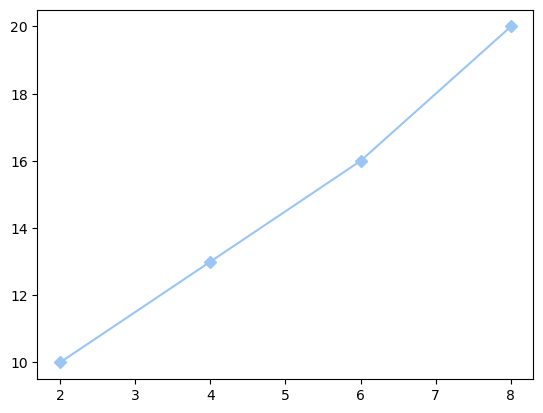
# line color 선 색상 변경
# RGB 색상 적용 (빨강, 초록, 파랑)
plt.plot(x, y, color = '#9AC5F4', marker='D')
plt.show()
In [9]:
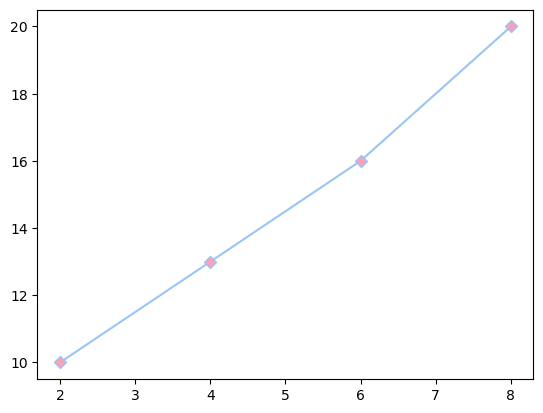
# marker color 마커 색상 - markerfacecolor -> mfc
plt.plot(x, y, color = '#9AC5F4', marker='D', mfc='#FBA1B7')
plt.show()
In [10]:
# 마커 선 색상 - markeredgecolor -> mec
plt.plot(x, y, color = '#9AC5F4', marker='D', mfc='#FBA1B7', mec='#6528F7')
plt.show()
In [11]:
import numpy as np
In [12]:
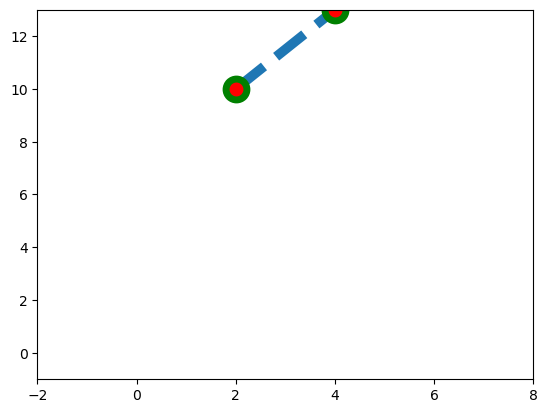
# 그래프 범위 지정
plt.xlim(-2, 8)     # x축 범위 지정 (최소, 최대)
plt.ylim(-1, 13)    # y축 범위 지정
plt.plot(x, y, ls = '--', lw = 7, marker='o', mfc = 'r', mec = 'g', ms = 15, mew = 5)
plt.show()
In [13]:
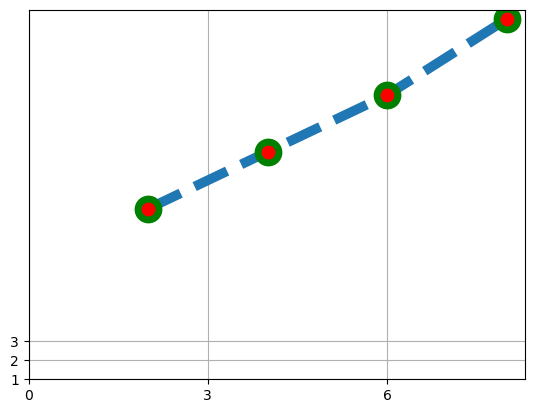
# 틱의 위치를 보기 위해 격자무늬 표현
# tick - 그래프 축의 위치
plt.plot(x, y, ls = '--', lw = 7, marker='o', mfc = 'r', mec = 'g', ms = 15, mew = 5)
plt.xticks( [0, 3, 6] )     # x축 틱 설정
plt.yticks( [1, 2, 3] )     # y축 틱 설정
plt.grid()
plt.show()
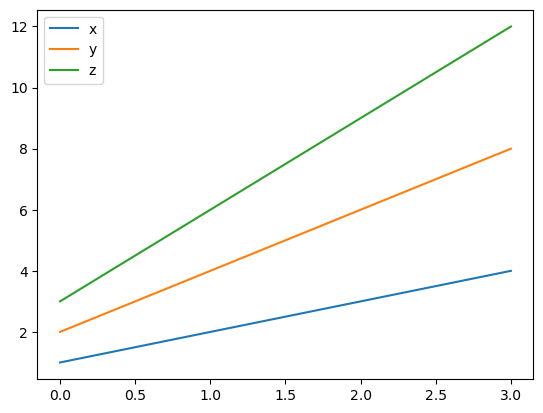
In [14]:
# 여러 plot 그리기
x = [1, 2, 3, 4]
y = [2, 4, 6, 8]
z = [3, 6, 9, 12]

# 그래프에 이름 부여
plt.plot(x, label='x')
plt.plot(y, label='y')
plt.plot(z, label='z')
plt.legend()
plt.show()
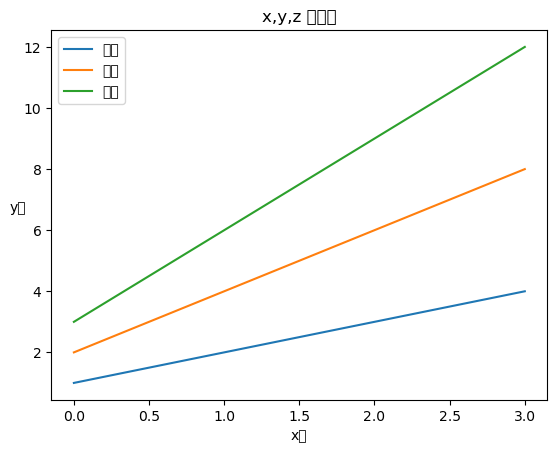
In [15]:
plt.plot(x, label='엑스')
plt.plot(y, label='와이')
plt.plot(z, label='제트')
# 축에 이름 표시
plt.xlabel('x축')
plt.ylabel('y축', rotation = 0)
# 그래프의 이름
plt.title('x,y,z 그래프')
plt.legend()     # 범례. 그래프 label 출력
plt.show()
In [16]:
# 한글 지원 폰트 변경
from matplotlib import rc
rc('font', family='Malgun Gothic')'Study > Python' 카테고리의 다른 글
| [Python] Train Data 실습 (0) | 2023.10.18 |
|---|---|
| [Python] Numpy 배열 (1) | 2023.10.17 |
| [Python] pandas라이브러리 CrimeData 실습 (0) | 2023.10.13 |
| [Python] 함수 (0) | 2023.10.12 |
| [Python] 딕셔너리 (0) | 2023.10.11 |


